Motivation
|
Retracted articles are a serious concern to the scientific community.
The goal for this project is to predict whether a scientific paper will be retracted or issued a correction after publication. Research publications are the major avenue for advancing the state of the art for any field of study. And through research, we are better able to understand the world around us. However, the advances of these scientific publications, which are often funded with public tax revenue, belong to the general population at large. Major corrections or even retractions can have a negative impact on the opinion and confidence in the role of scientists and researchers.
Recently, there have been many examples of major retractions from several scientific publications. The publisher BioMed Central has so far issued over 43 retractions in 2015 amidst an increasing scandal of fabricated peer-reviews. And these retractions are not limited to minor journals or fields of study. In 2010, Harvard economists Carmen Reinhardt and Kenneth Rogoff published a highly influential paper on the effect of debt-to-GDP ratios to a country’s economic growth. At the time, this paper was considered the “most influential article cited in public and policy debates about the importance of debt stabilization,” and likely lead many countries to impose steep austerity measures soon after the global recession. However, in 2013, it was found that an excel error completely undermined their central hypothesis. |
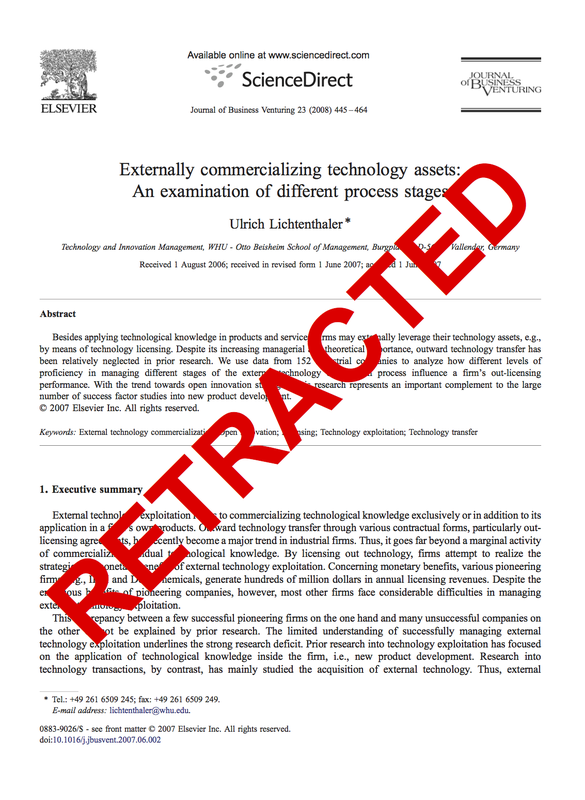
Figure 1: A retracted article
|
To predict whether an article will be retracted or corrected would be of great benefit to the scientific community at large.
Solution
|
Our initial data was collected from the PubMed Database. PubMed is a repository for scientific articles. Each entry in the database includes metadata for the article title, author names, journal title, abstract, author affiliations, and publication type (Journal vs Retraction). Using custom MATLAB scripts, we were able to collect large data sets (~1 million articles) to use for training and testing. In addition to the PubMed database, we also created several lookup tables to add additional attributes. A Journal Database was used to cross-reference and add Impact Factor, Eigenvalue, Total Citations, and Article Influence attributes. A University Database was used to cross-reference the author affiliations and add a University attribute. And a Country Database was similarly used to add a Country attribute. As a final step, we implemented bag of words on the abstract field, adding ~10,000 additional attributes of unique word frequency. Our last field, Publication Type was the target class to be predicted.
|
Table 1: Features and Type
|
We used three different machine learning algorithms for our problem: Decision Trees (J48), K-Nearest Neighbor (IBK K-NN), and Naive Bayes. We selected these three learners after much trial and error with experimentation. Decision Trees are very simple, and served as our baseline algorithm; the other two, K-Nearest Neighbor and Naive Bayes, are more sophisticated learners that are more adaptable to our large data set.
Testing
Table 2: Test Sets Performance. We found Decision Trees (J48) to be overly aggressive and classify everything as a Non-Retraction, K-Nearest Neighbor (K-NN) to behave well only on small feature sets, and Naive Bayes to behave okay on both small and large training sets alike.
| Algorithm | Total Instances | Number of Non-retractions | Number of Retractions | Number of Features | Cross-Validation | Total Accuracy | Mean Error | Correctly Identified Non-Retractions | Correctly Identified Retraction |
|---|---|---|---|---|---|---|---|---|---|
| J48 | 498 | 449 | 49 | 9 | 10 | 90.2% | 0.18 | 100% | 0% |
| K-NN | 498 | 449 | 49 | 9 | 10 | 86.4% | 0.14 | 92.6% | 28.6% |
| Naive Bayes | 498 | 449 | 49 | 9 | 10 | 84.5% | 0.17 | 92.4% | 12.2% |
| J48 | 743 | 670 | 73 | 9 | 10 | 90.2% | 0.18 | 100% | 0% |
| K-NN | 743 | 670 | 73 | 9 | 10 | 85.9% | 0.15 | 93.4% | 16.4% |
| Naive Bayes | 743 | 601 | 73 | 9 | 10 | 86% | 0.19 | 84.8% | 12.3% |
| J48 | 998 | 899 | 99 | 9 | 10 | 90.2% | 0.18 | 100% | 0% |
| K-NN | 998 | 899 | 99 | 9 | 10 | 85.4% | 0.15 | 82.5% | 26.3% |
| Naive Bayes | 998 | 899 | 99 | 9 | 10 | 84.6% | 0.17 | 82.6% | 16.2% |
The performance of our algorithms on training sets of 100%, 75%, and 50% of 1000 random examples can be seen above in Table 2. Since our goal is to predict whether an article is correctly classified as a retraction, we will use the last column of the above table as our measure of success.
We found that Decision Trees had a high total accuracy (90.2% for all three sizes of training sets), but also extremely aggressive in labeling all examples as false, and 0% as true. K-Nearest Neighbor and Naive Bayes have similar total accuracy; however, K-Nearest Neighbor is twice as accurate at correctly identifying retractions than Naive Bayes (26.3% vs. 16.2% for 1000 examples).
In addition, we found that the most important features for the task were Author and Journal.
Table 3: Test Set Performance with and without Bag of Words.
| Algorithm | Total Instances | Number of Non-Retractions | Number of Retractions | Number of Features | Cross-Validation | Total Accuracy | Mean Error | Correctly Identified Non-Retractions | Correctly Identified Retraction |
|---|---|---|---|---|---|---|---|---|---|
| J48 | 700 | 602 | 98 | 9 | 10 | 86.0% | 0.24 | 100% | 0% |
| K-NN | 700 | 602 | 98 | 9 | 10 | 77.9% | 0.23 | 88.7% | 11.2% |
| Naive Bayes | 700 | 602 | 98 | 9 | 10 | 81.4% | 0.24 | 92.2% | 15.3% |
| J48 | 700 | 602 | 98 | 15924 | 10 | 86.0% | 0.24 | 99.8% | 0% |
| K-NN | 700 | 602 | 98 | 15924 | 10 | 28.0% | 0.72 | 19.2% | 81.6% |
| Naive Bayes | 700 | 602 | 98 | 15924 | 10 | 69.5% | 0.30 | 77.6% | 19.4% |
In general, we found that Bag of Words did not improve the accuracy of our learning algorithms, likely due to relative scarcity of unique words in the generated vocabulary list. For Decision Trees, including Bag of Words had no change on the classification; for K-NN, the number of correctly identified retractions increased, but there was a subsequent increase in the number of false positives which resulted in a lower total accuracy (likely rooted in the curse-of-dimensionality); for Naive Bayes, including Bag of Words increased the true-positive percentage, but decreased the true-negative percentage.
Results
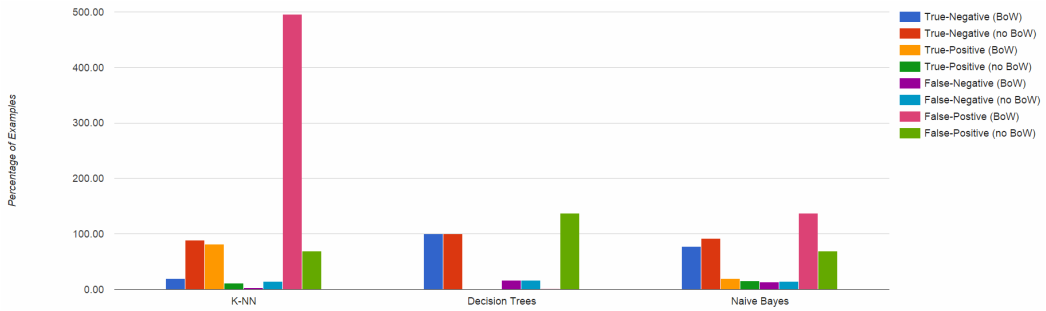
Figure 2: Cross-validated results on 700 example test set, with and without Bag of Words.
After looking at the retraction and non retraction accuracy values for the three different algorithms, we came to a conclusion that Bag of Words helps in improving the retraction predictions but will result in a much larger number of false-positives. We think this is mainly due to the size of the vocabulary list created by Bag of Words. Even though these attributes may be meaningful, the large dimensions of the feature set resulted in a lot of noise. As an example, K-Nearest Neighbors with Bag of Words resulted in a 500% false-positive rate. If for example, this tool was used to make decisions on which articles would be published, a disproportion of articles would be flagged as a likely retraction or correction. Decision Trees create a similar problem, with articles that should be rejected being considered for publication.
The use of Naive Bayes provides a balance between overall accuracy and selection of retracted/corrected papers. Both with and without Bag of Words, the true-positive accuracy was 19% and 15%. This represent a large number of publications incorrectly being classified as non-retraction/correction types, but the model was not impacted by increased noise from Bag of Words. In conclusion, the Naive Bayes model was arguably the best algorithm, but still gives a low accuracy rate for detecting retraction / corrections. This is a reasonable outcome when taken into account that the current ratio of retracted/corrected articles to total published articles is less than 0.0001%.
The use of Naive Bayes provides a balance between overall accuracy and selection of retracted/corrected papers. Both with and without Bag of Words, the true-positive accuracy was 19% and 15%. This represent a large number of publications incorrectly being classified as non-retraction/correction types, but the model was not impacted by increased noise from Bag of Words. In conclusion, the Naive Bayes model was arguably the best algorithm, but still gives a low accuracy rate for detecting retraction / corrections. This is a reasonable outcome when taken into account that the current ratio of retracted/corrected articles to total published articles is less than 0.0001%.
